Contact Us
Complex Visualizations and Charts
Find the true power of your data with our visualizations
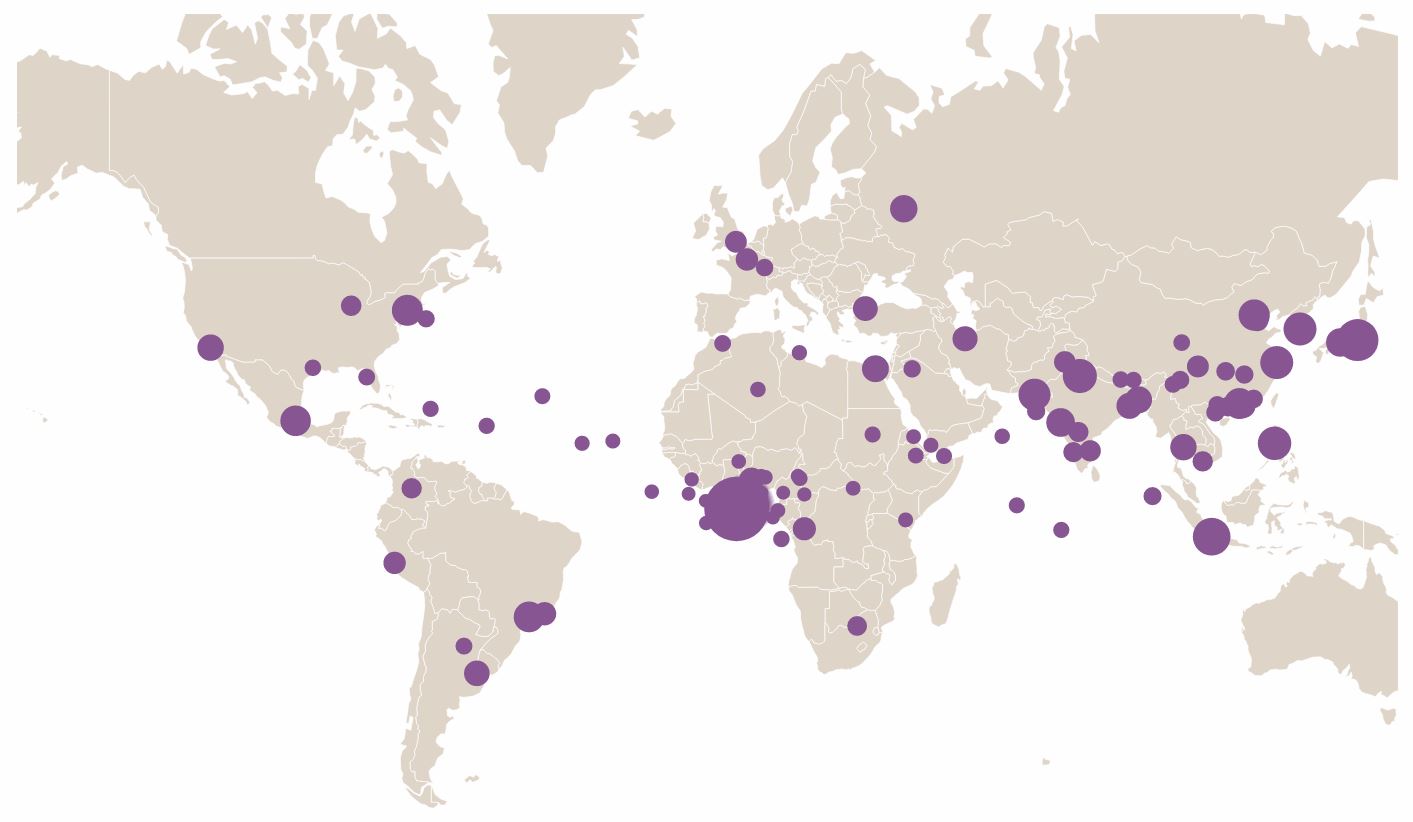
Gooey Effect - Populated Cities
View
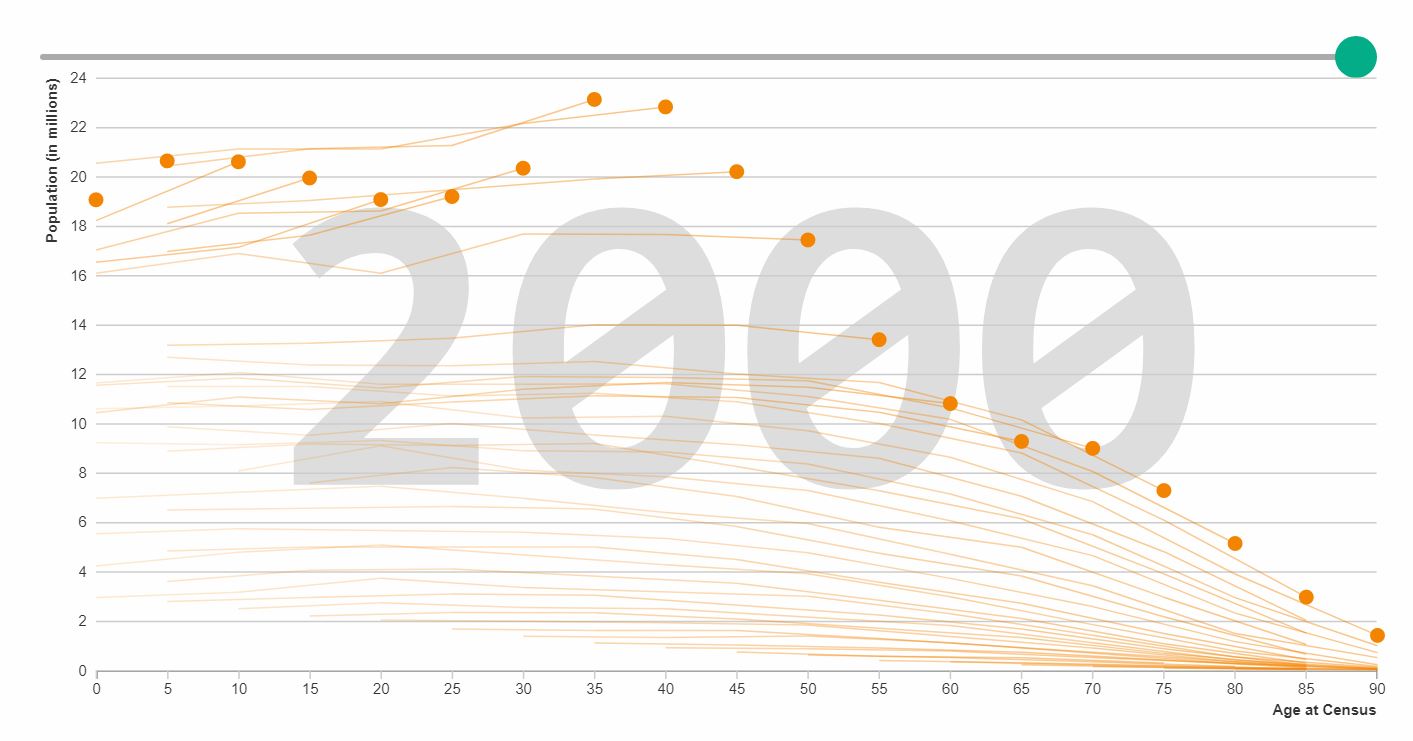
Cohort Chart - Life Expectancy
View
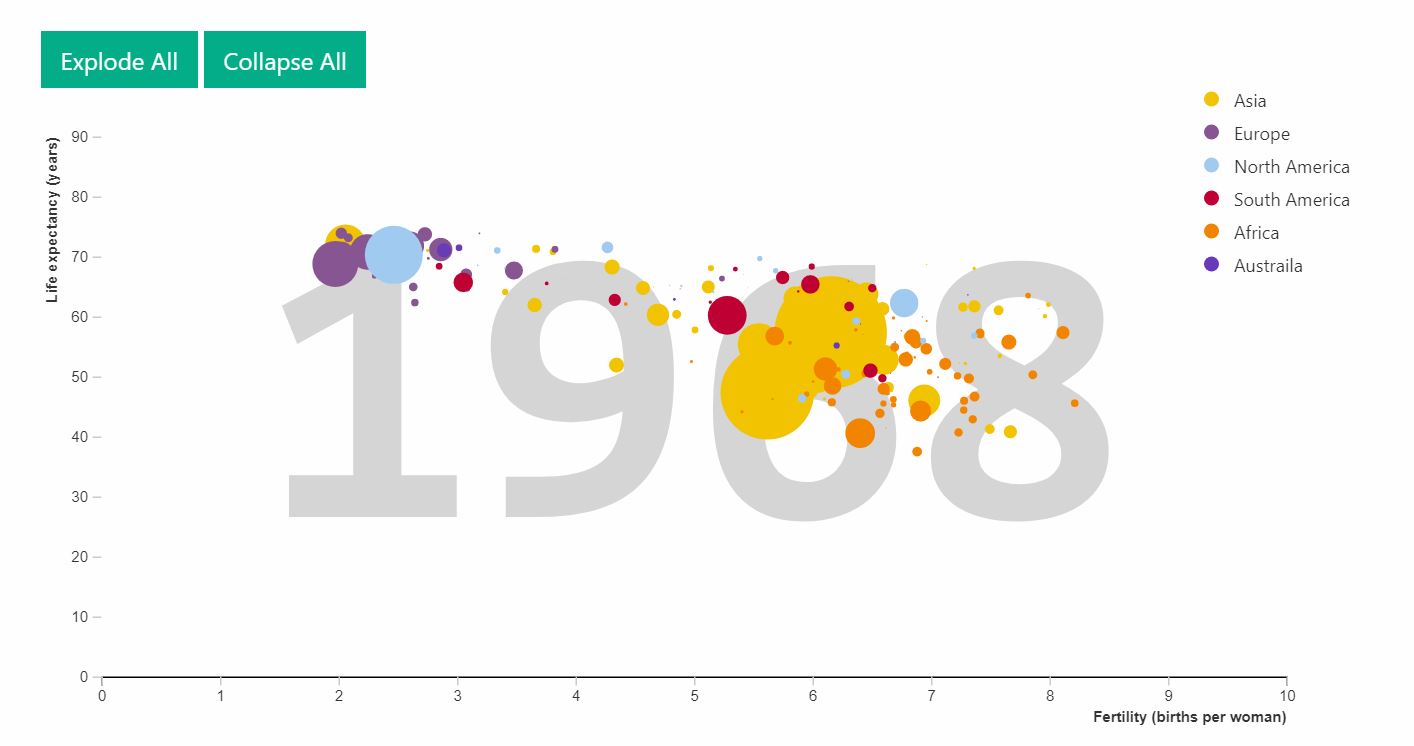
Movable Bubble - The Fertility Rate
View
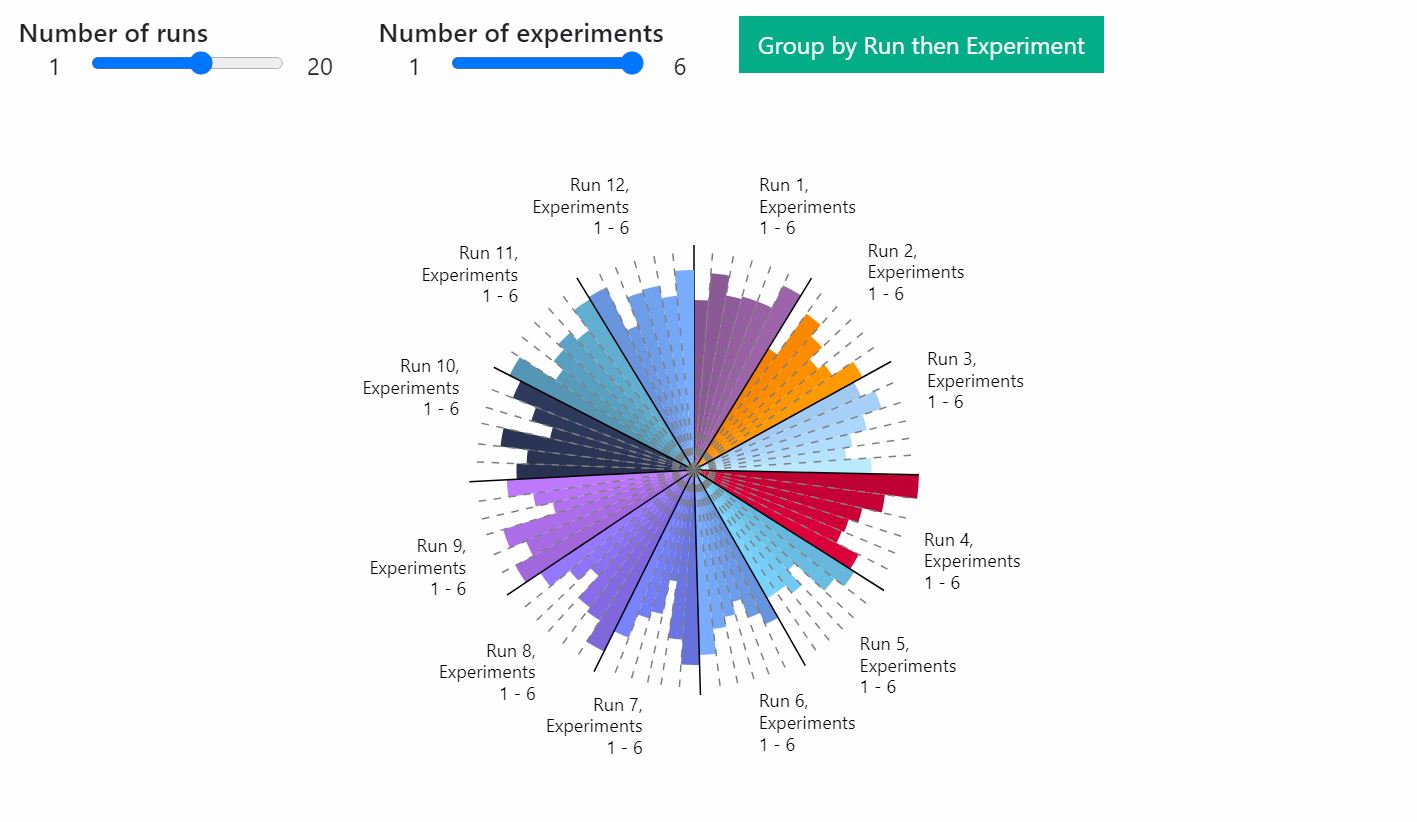
Multi-level Nested Pie - Experiments
View
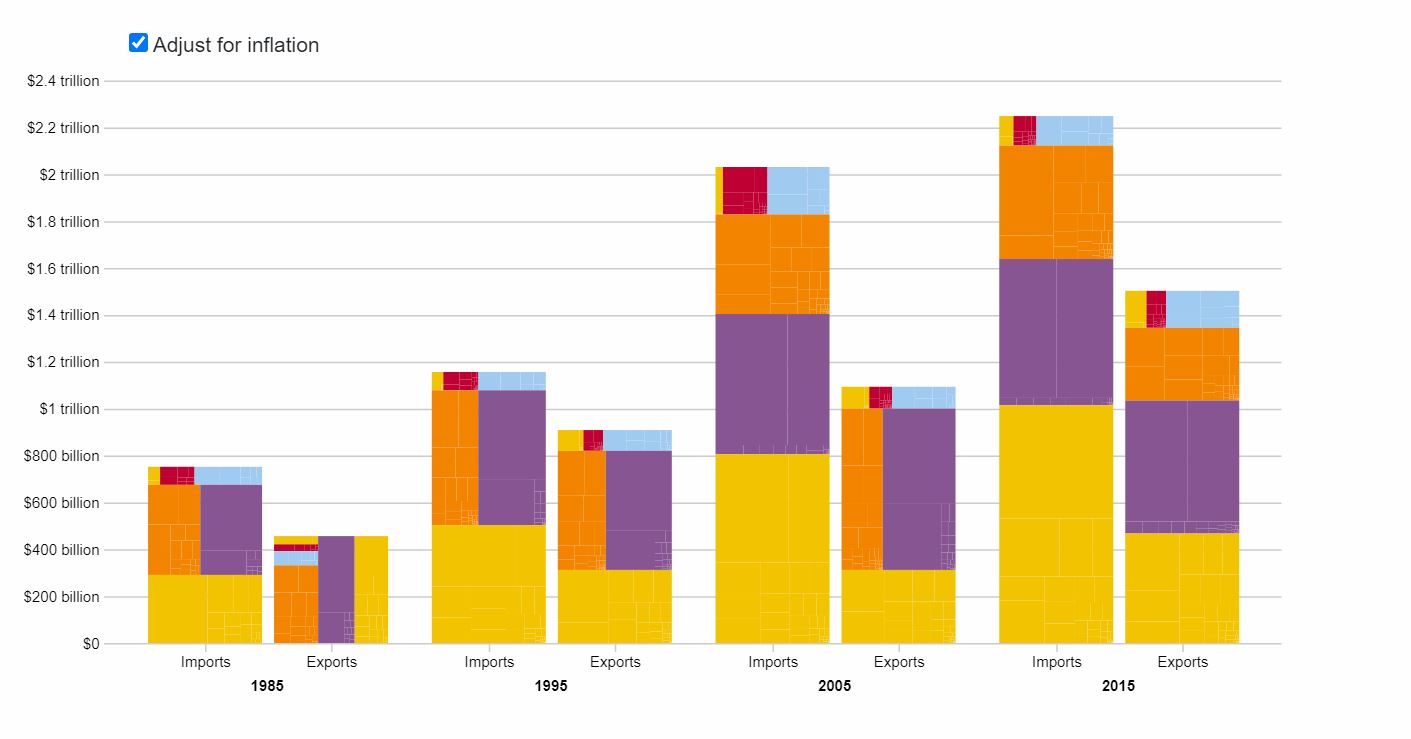
Treemap Bar - Imports & Exports
View
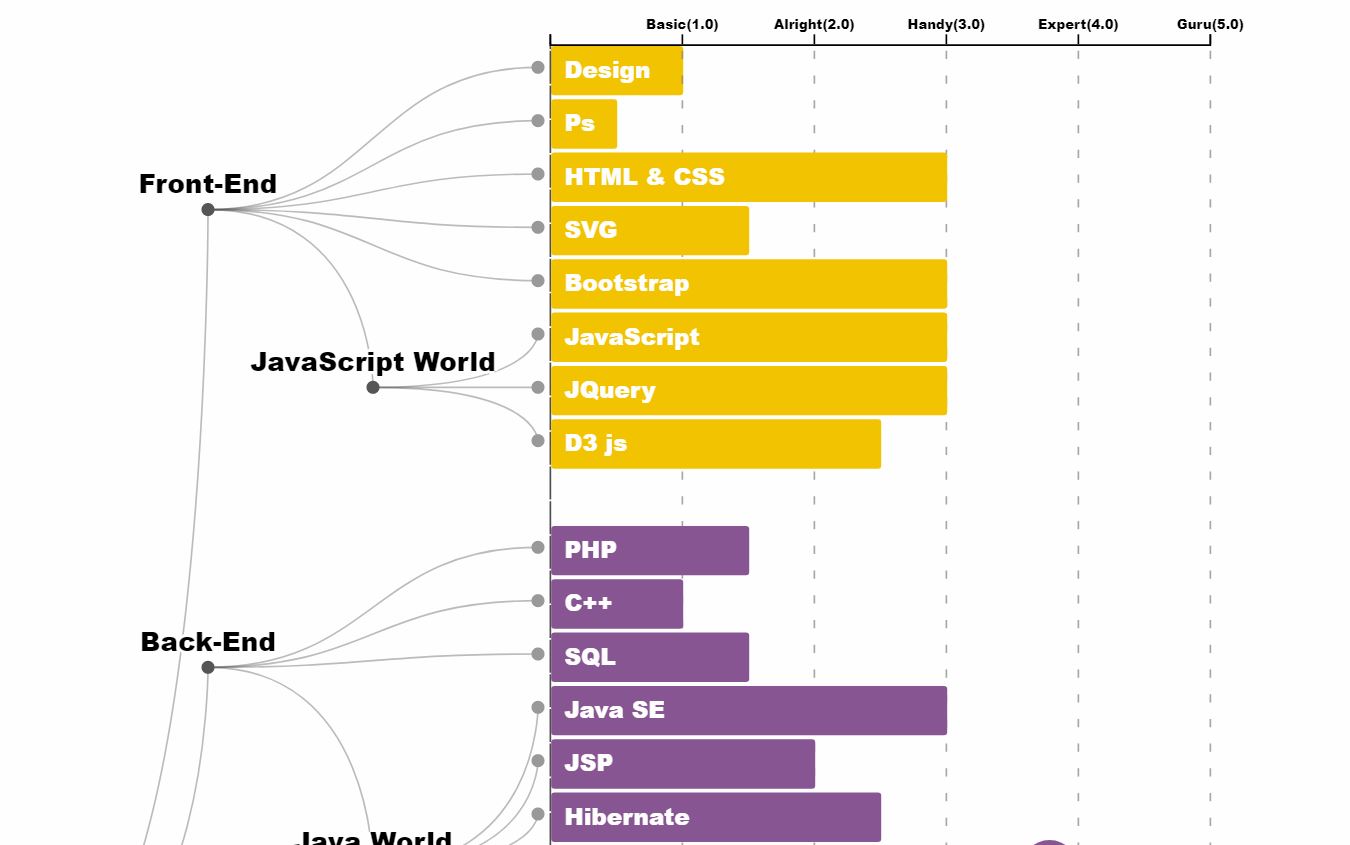
Dendrogram - Web Technologies
View
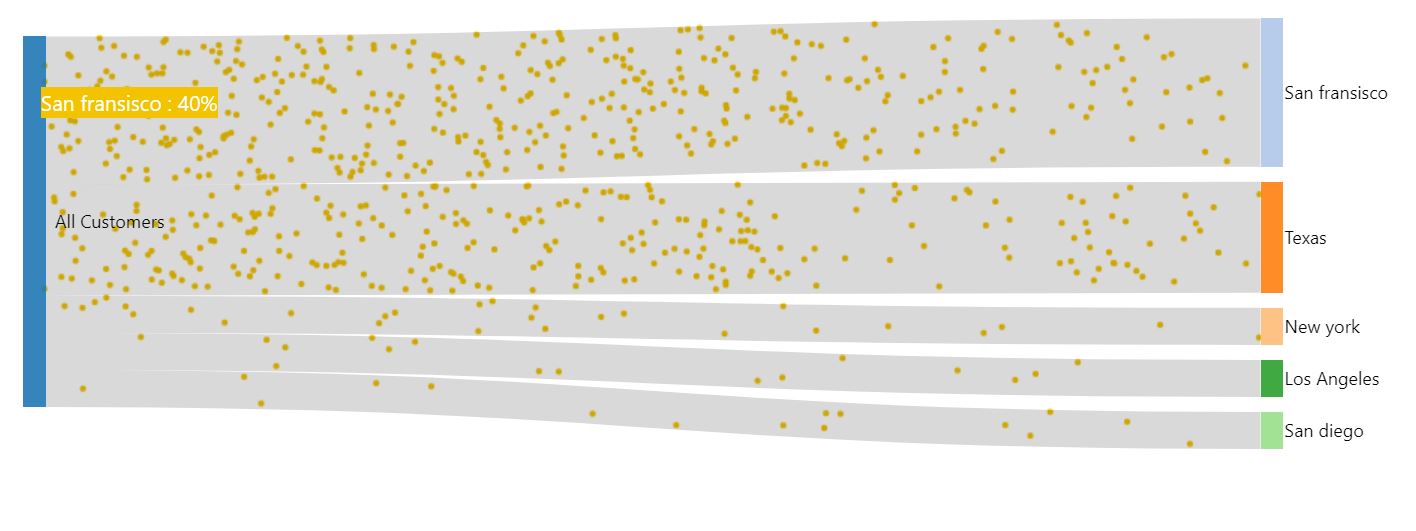
Sankey Chart - Customer Flow
View
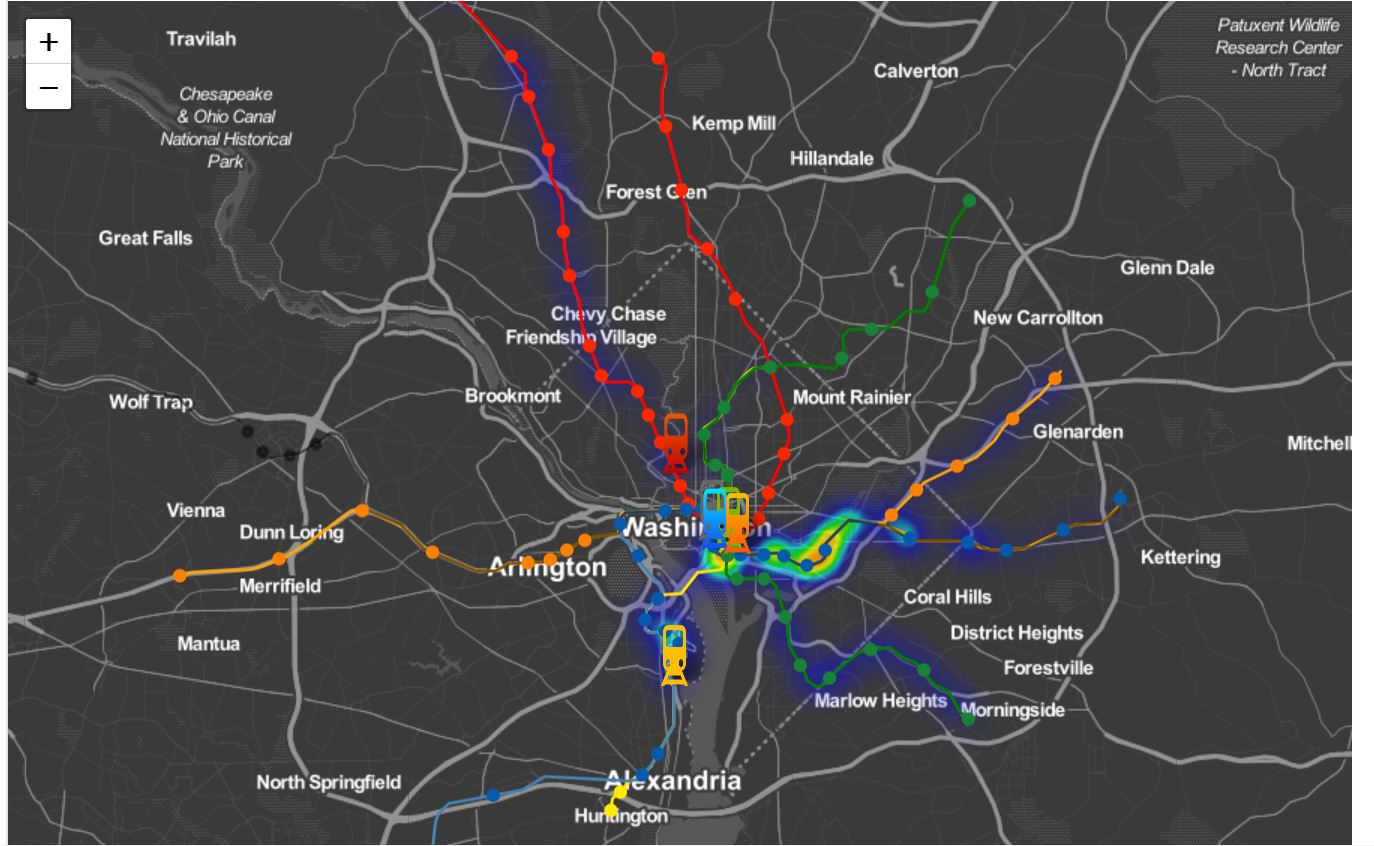
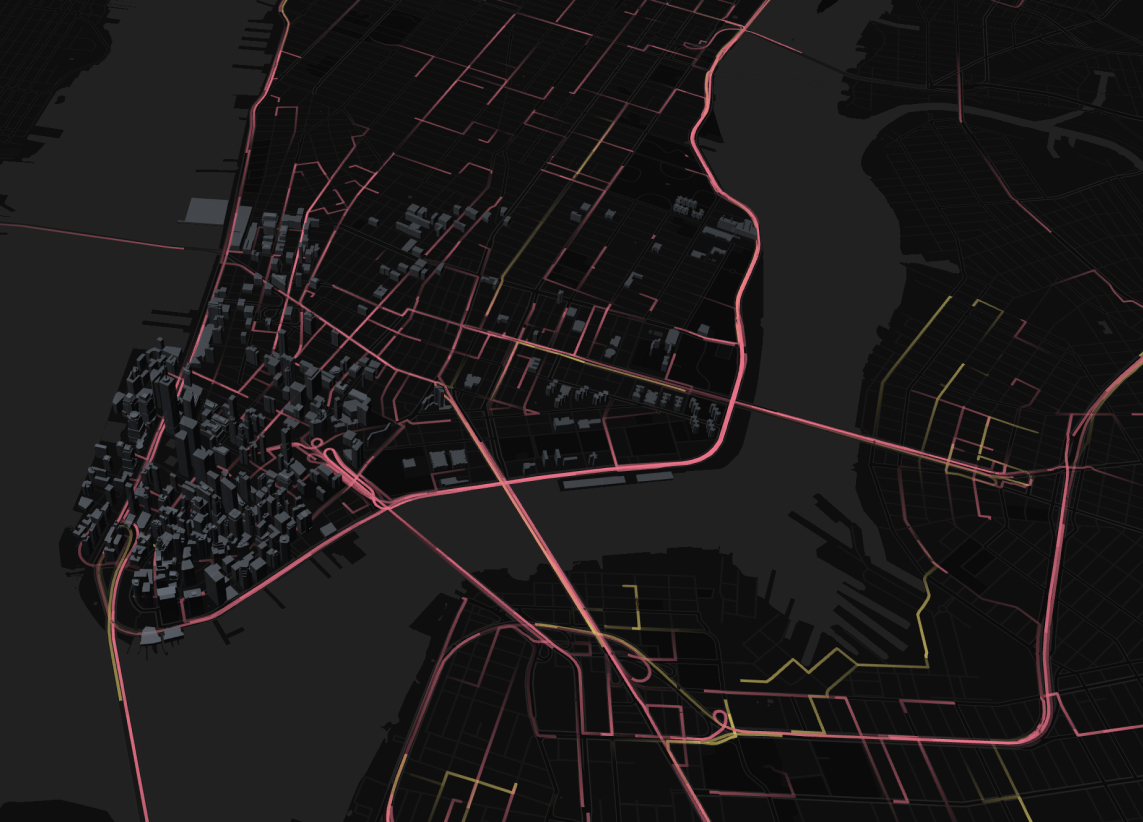
Leaflet heatmap - Metro Transit
View
Movable bubble - Passenger Flow
View
Time-Space Distribution Map
View